A campaign report is a handful of counts and the rates between them. To read one well, you need to know
two things about every rate: what it divides by, and what can make the count on top wrong. This guide
goes through both, metric by metric.
This guide covers:
- The five counts behind every report
- Delivery: delivered and bounced
- Engagement: opens, clicks and unsubscribes
- Why opens and clicks can mislead
- Complaints: the number providers watch
- Outcomes: conversions, revenue and ROI
- Reading a campaign report in AcelleMail
- Which numbers to judge a campaign by
It ends with the most common mistakes and a one-screen summary.
1. The five counts behind every report#
Every rate in a campaign report is one of five counts divided by another:
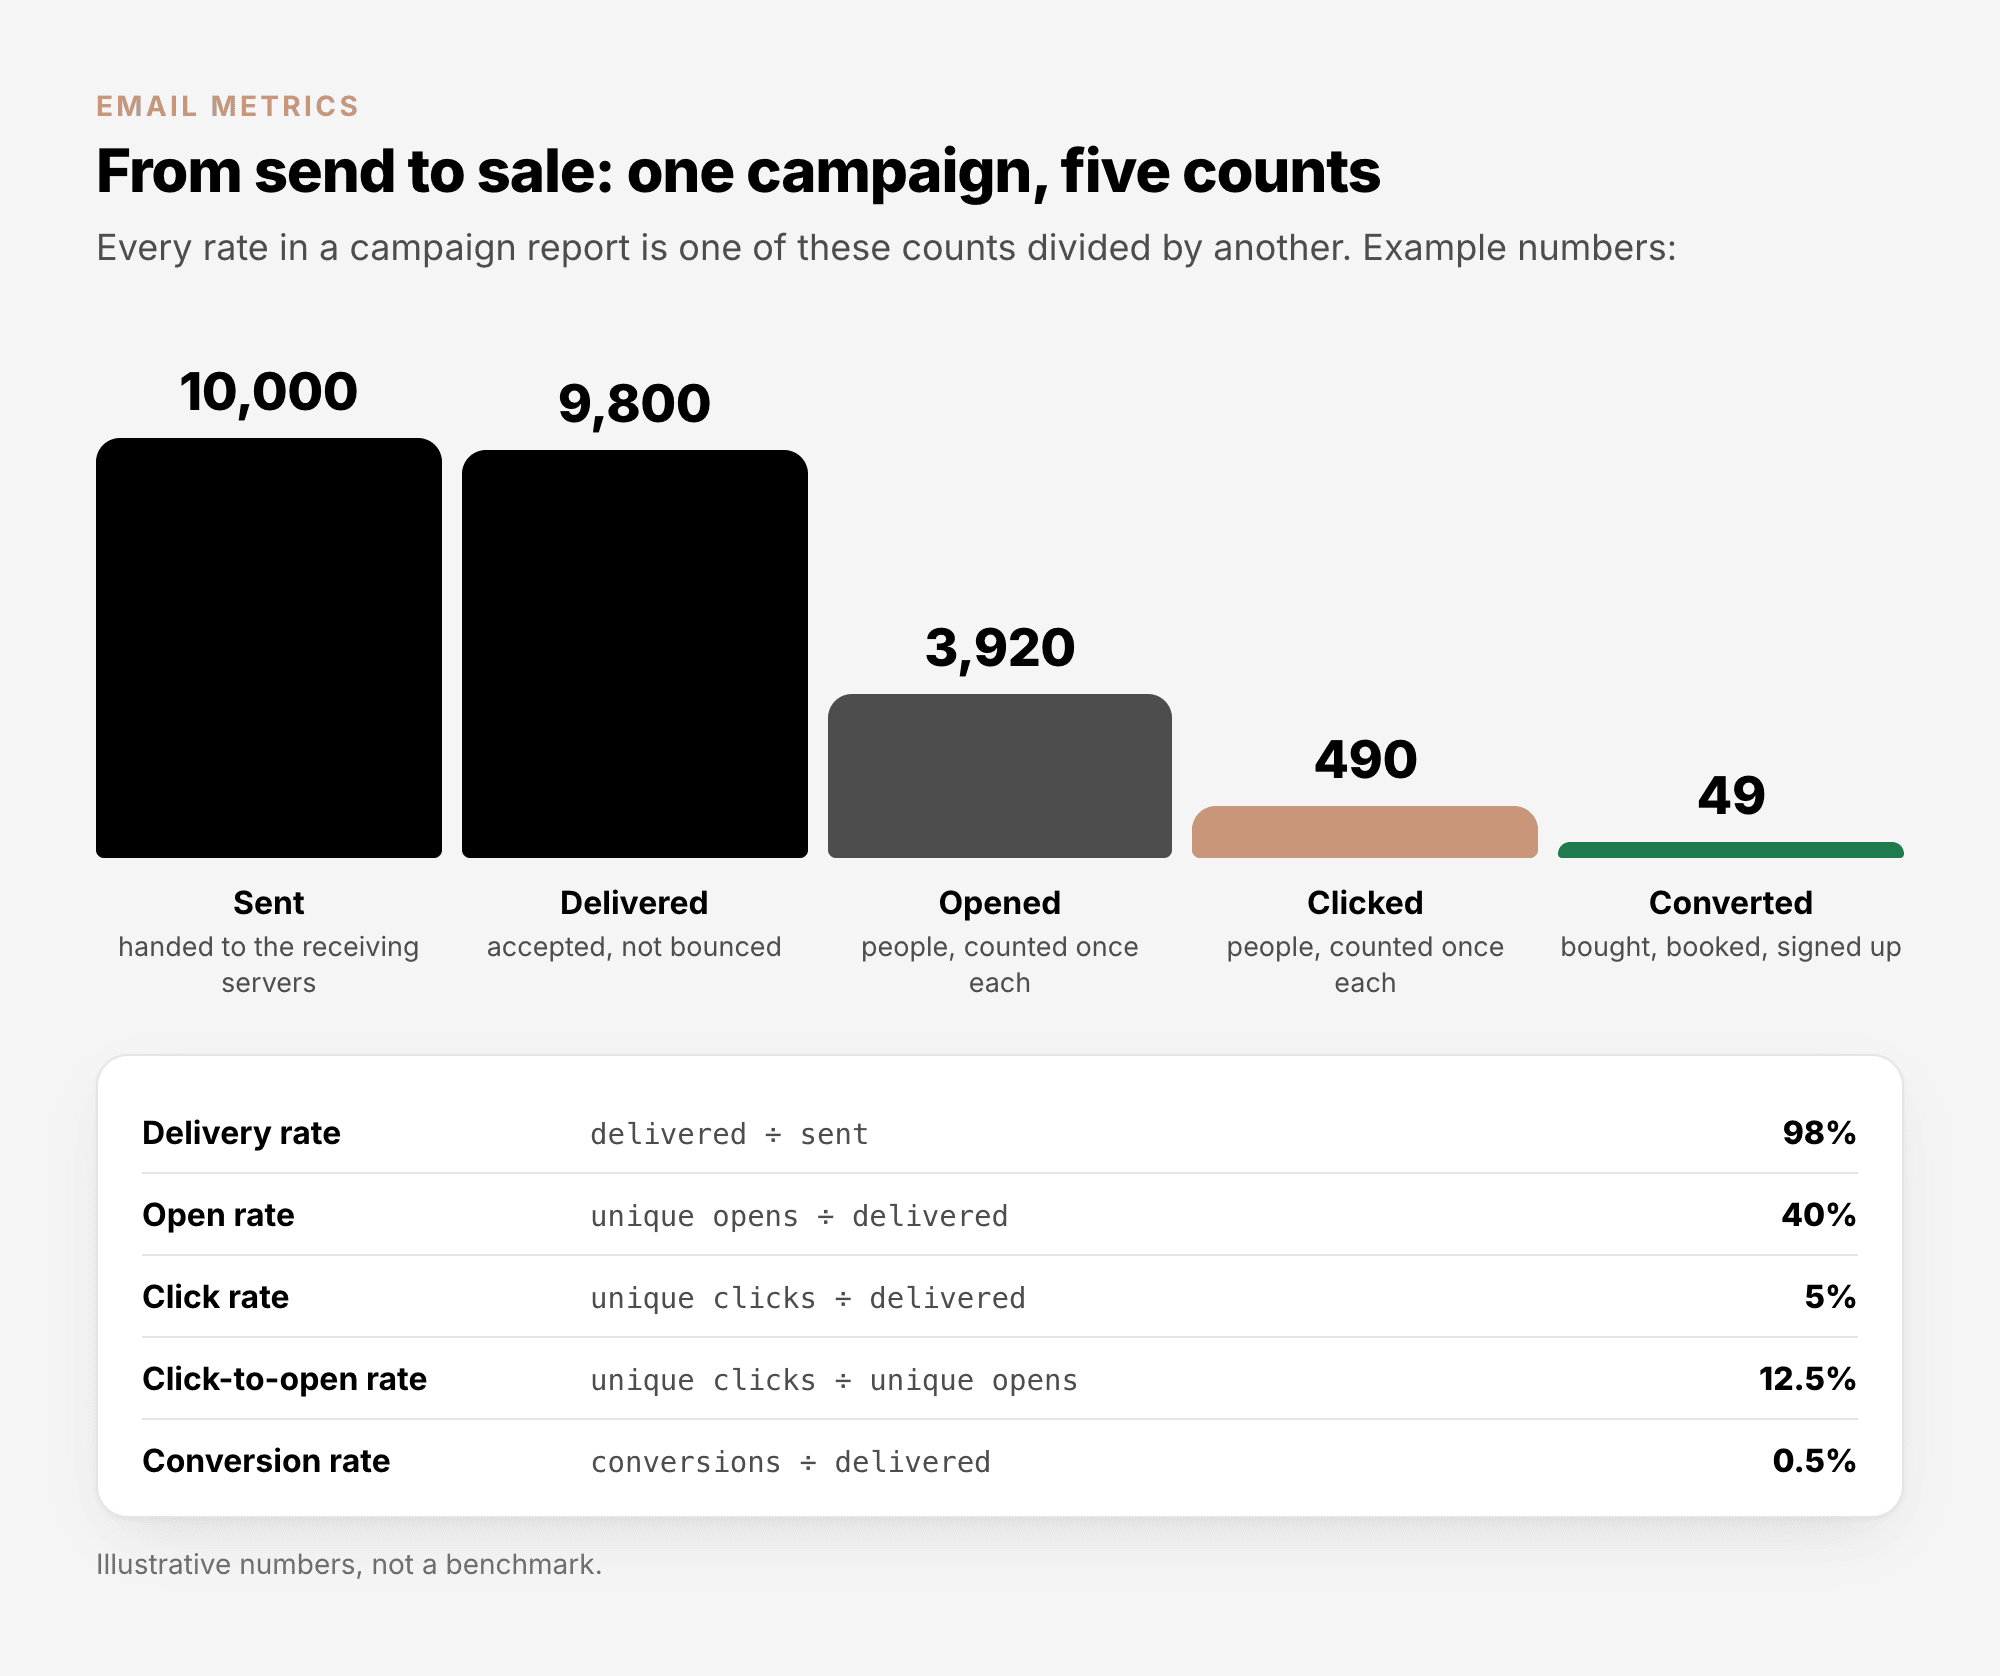
Two conventions decide whether two numbers can be compared:
- Unique or total. A unique count counts each person once, however many times they opened or
clicked. A total count includes every repeat. Rates use unique counts; a total is useful only to see
how often people came back.
- What the rate divides by. Most tools divide opens and clicks by delivered, some by sent. The
same campaign can show two different open rates in two tools. Check before you compare.
2. Delivery: delivered and bounced#
| Metric |
Formula |
What it tells you |
| Delivered |
sent − bounced |
How many messages the receiving servers accepted. It says nothing about inbox or spam folder. |
| Delivery rate |
delivered ÷ sent |
The share that was accepted. |
| Bounce rate |
bounced ÷ sent |
The share that was refused. Split it by type before you act on it. |
| Hard bounce rate |
hard bounces ÷ sent |
The quality of your list. On a list collected with consent and cleaned regularly, it stays close to zero. |
A hard bounce is permanent (the address does not exist); a soft bounce is temporary (a full
mailbox, a busy server). Sending services judge you on hard bounces. Amazon SES, for example, counts
"only hard bounces", asks senders to stay below 2%, puts an account under review at 5% and may pause
sending at 10% (Amazon SES sending review
FAQ). Other services publish their own
limits.
A high delivery rate does not mean your mail reached the inbox. That second decision is covered in
Email Deliverability Explained; what to do about hard
bounces is in Email List Quality Explained.
3. Engagement: opens, clicks and unsubscribes#
| Metric |
Formula |
What it tells you |
| Open rate |
unique opens ÷ delivered |
Roughly how many people saw the email. Useful for trends in your own sends, weak as an absolute (section 4). |
| Click rate |
unique clicks ÷ delivered |
How many people acted on the email. The most dependable engagement signal you have. |
| Click-to-open rate (CTOR) |
unique clicks ÷ unique opens |
How well the content persuaded the people who opened. Automatic opens push it down. |
| Unsubscribe rate |
unsubscribes ÷ delivered |
How many people decided they no longer want your mail. A jump after one campaign points at its content or its timing. |
How the counts are collected matters for what follows. An open is recorded when a tiny image in the
email, a tracking pixel, loads from your server. A click is recorded when a link first passes
through a tracking address that notes the click and then forwards the reader. In AcelleMail both are
switched on per campaign, with Track opens and Track clicks under Advanced Settings in the
campaign's Setup step. With either switched off, its rate stays at zero.
4. Why opens and clicks can mislead#
Both signals depend on software behaving like a reader, and three things break that link:
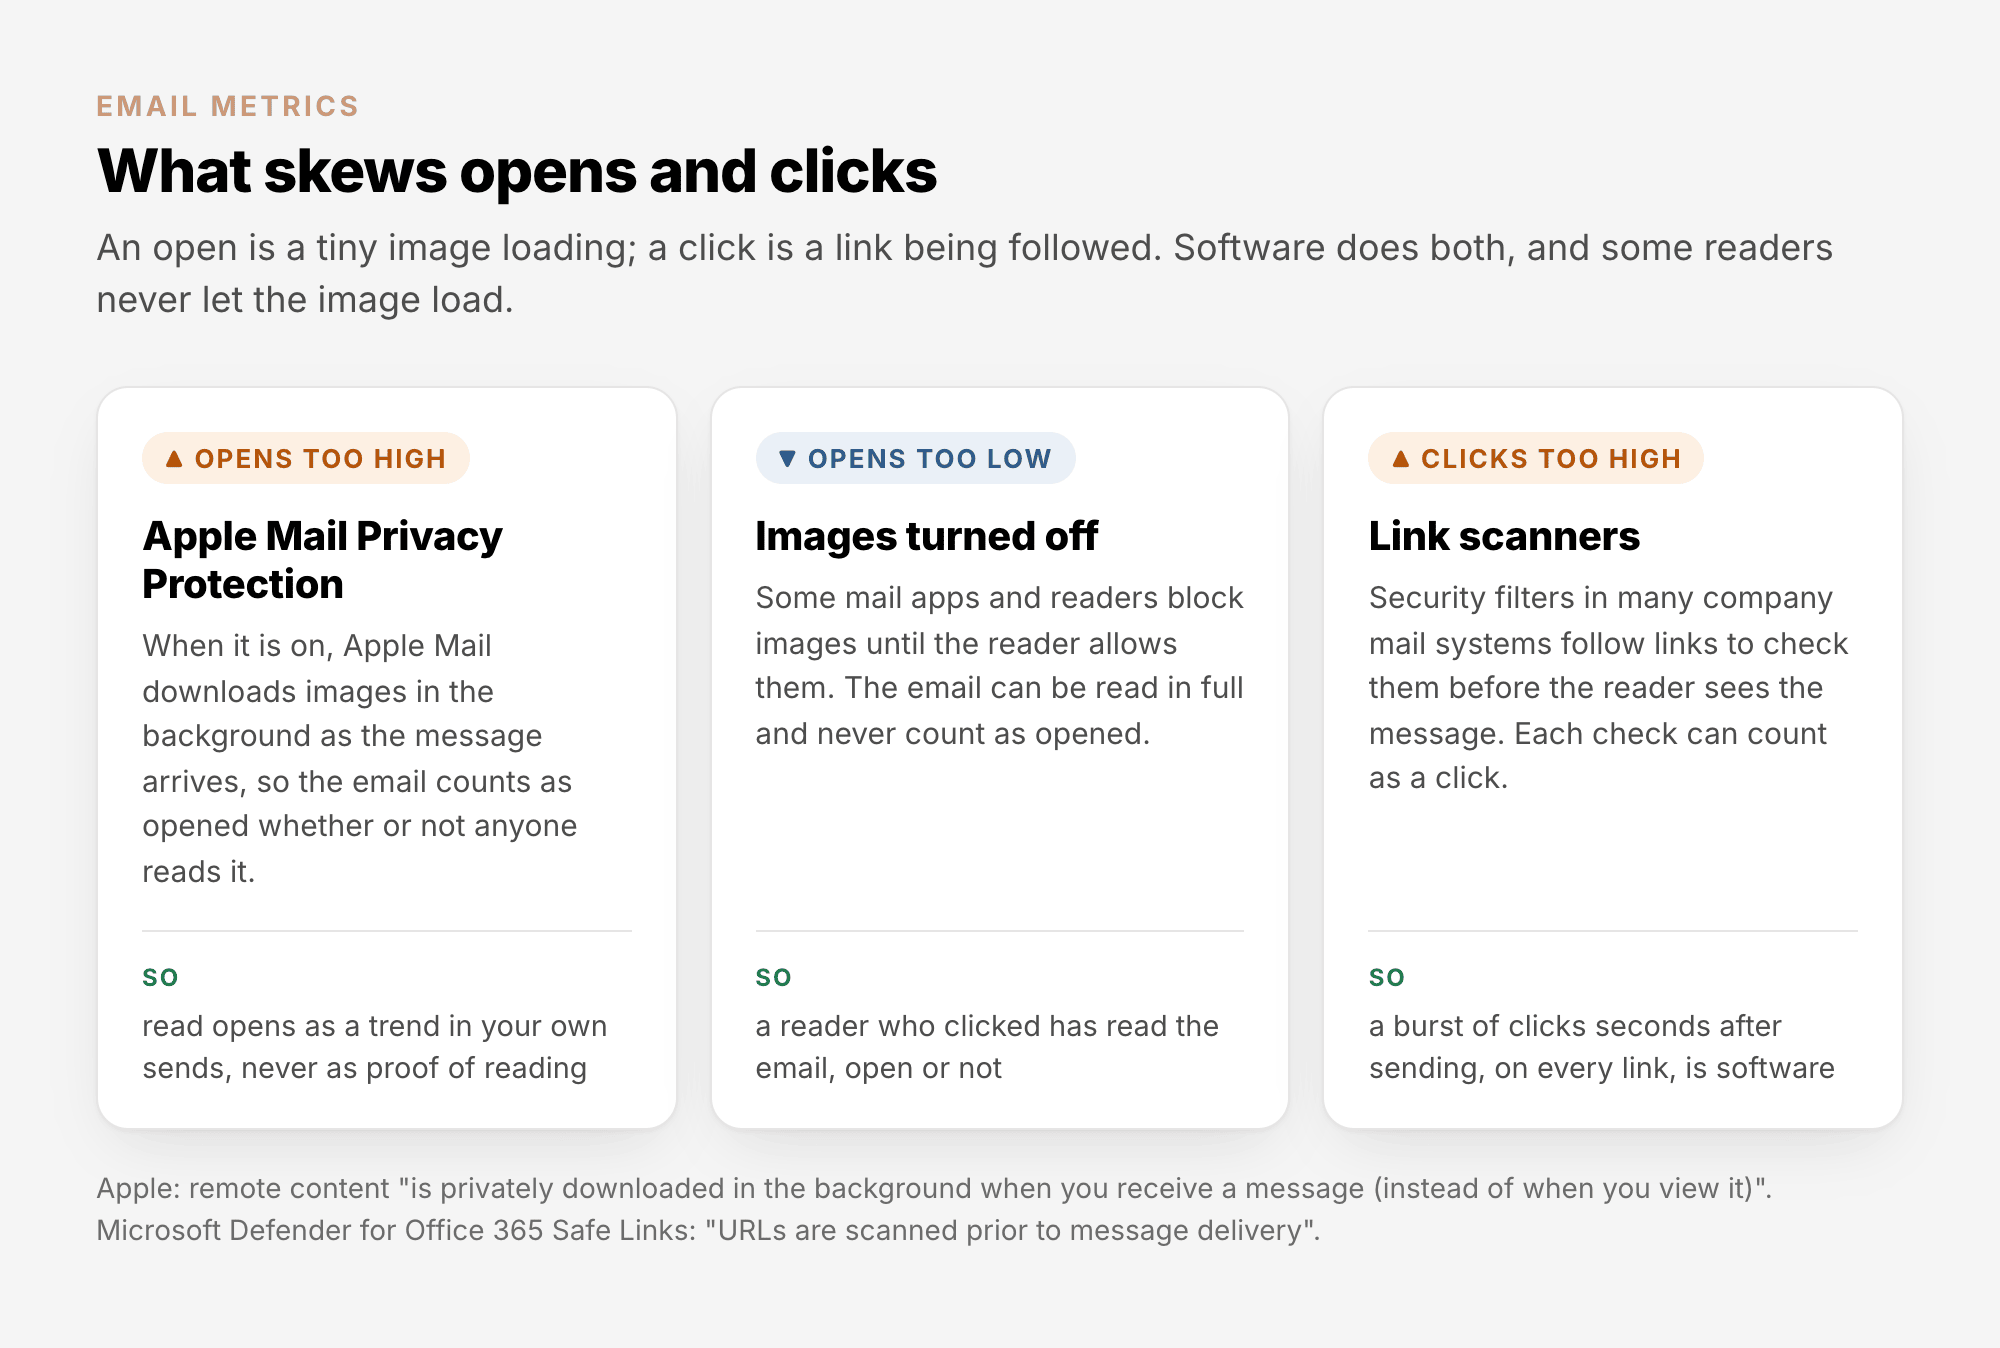
Apple Mail Privacy Protection. With it on, Apple Mail loads the images in an email when the message
arrives: remote content "is privately downloaded in the background when you receive a message (instead
of when you view it)" (Apple, Mail on
Mac). In Apple's words the
feature "prevents senders from seeing if you've opened the email message they sent you" (Apple, Mail on
iPhone). Every
Apple Mail reader who turned it on counts as an open, read or not. The share varies with your audience,
so the same open rate can mean different things on two lists.
Images turned off. Some mail apps, and some readers, load images only when asked. Those people can
read the whole email and never count as an open. A click still counts, so a reader who clicked has read
the email whether or not an open was recorded.
Link scanners. Security filters in many company mail systems follow the links in incoming mail to
check them. Microsoft Defender for Office 365, for one, says "URLs are scanned prior to message
delivery" (Microsoft). A scan
can register as a click. The pattern gives it away: every link in the email clicked within seconds of
delivery, often from the same company domain.
What this means in practice:
- Judge a campaign's success by clicks and what came after them, not by opens.
- Use the open rate to compare your own sends with each other: the same list, a similar time, two
subject lines in an A/B test.
- Look past opens when you decide who has gone quiet; clicks are the better sign of a reader who left.
See Email List Quality Explained, section 6.
5. Complaints: the number providers watch#
The complaint rate (also called spam rate) is complaints ÷ delivered: how many people pressed
"Report spam". It is the one engagement number mailbox providers publish limits for:
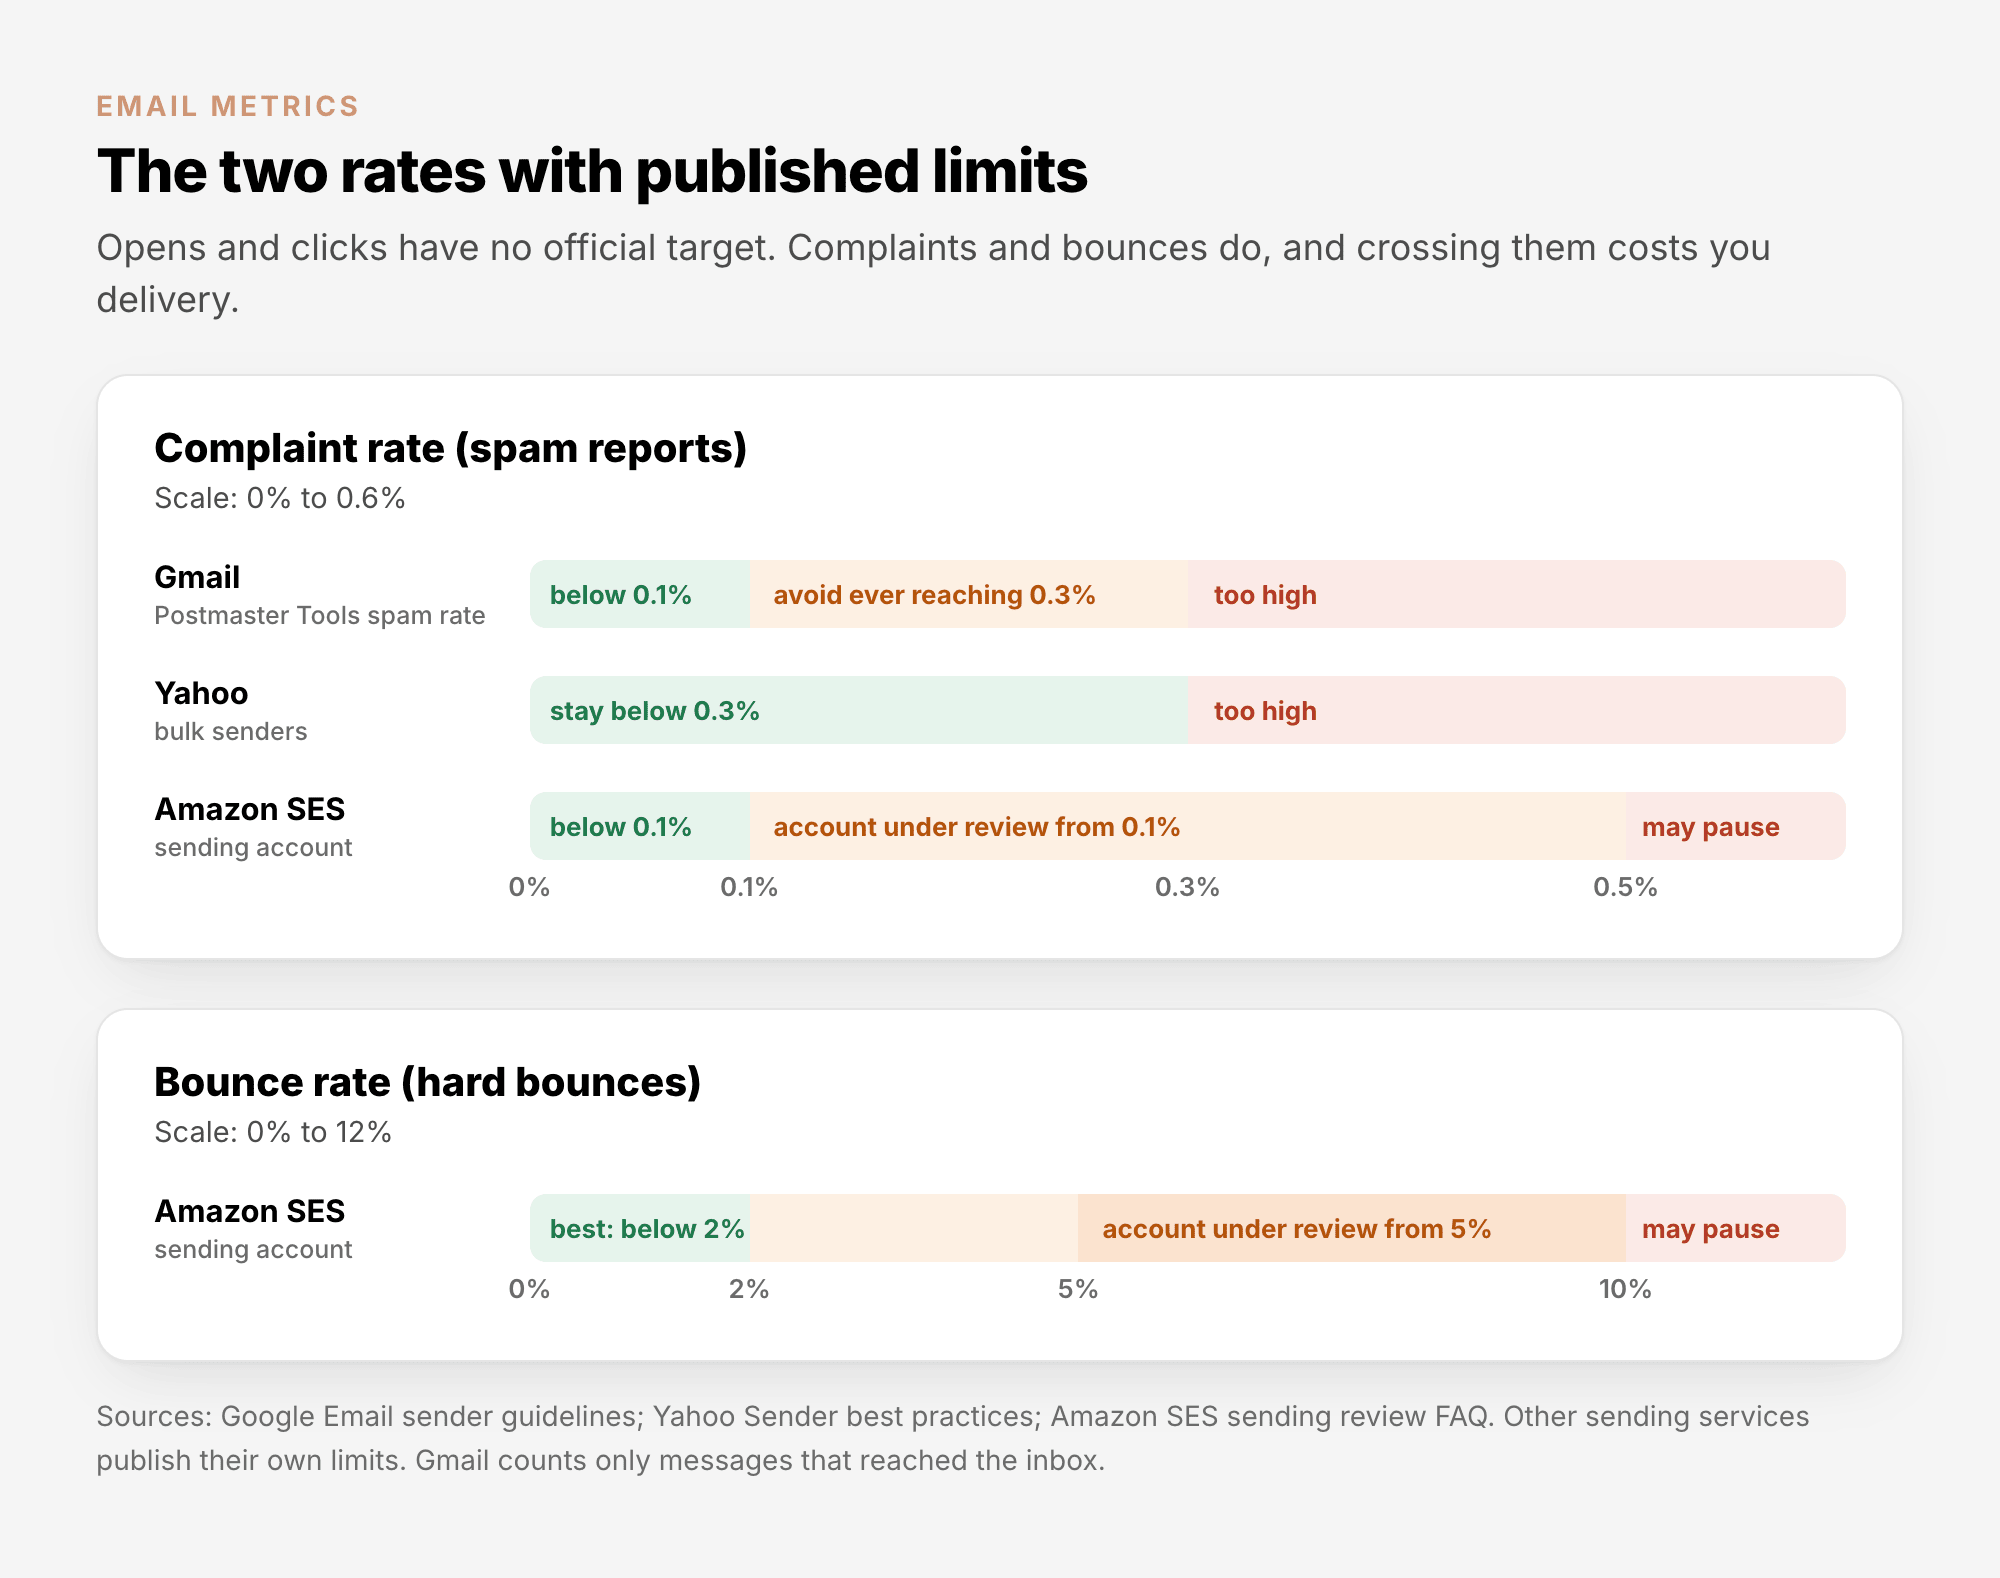
- Gmail asks senders to "keep spam rates reported in Postmaster Tools below 0.10% and avoid ever
reaching a spam rate of 0.30% or higher" (Email sender
guidelines). It counts only mail that reached the inbox:
the spam rate "is the percent of your messages that are delivered to engaged recipient's Inbox and
then marked as spam by the recipient".
- Yahoo asks bulk senders to stay below 0.3% (Sender best
practices).
- Amazon SES puts an account under review at 0.1% and may pause sending at 0.5%, counting only "mail
sent to domains that send complaint feedback to SES".
Why your report shows fewer complaints than there are. A sending platform hears about a complaint
only when the mailbox provider reports it back through a feedback loop. Gmail does not report individual
complaints at all; its spam rate is visible only in Gmail Postmaster
Tools. A campaign report that shows zero complaints
means none came back, not that nobody complained.
6. Outcomes: conversions, revenue and ROI#
| Metric |
Formula |
What it tells you |
| Conversion rate |
conversions ÷ delivered, or ÷ unique clicks |
How many recipients did what the email asked: bought, booked, signed up. Always say which denominator you used. |
| Revenue per email |
revenue from the campaign ÷ delivered |
What each delivered email earned. Lets you compare campaigns of different sizes. |
| Return on investment (ROI) |
(revenue − cost) ÷ cost |
Whether the campaign paid for itself. |
| List growth rate |
(new contacts − contacts lost) ÷ contacts at the start of the period |
Whether the list grows faster than it loses unsubscribes, bounces and complaints. |
None of these happen in the email, so your email platform cannot see them on its own. Tag your links so
your analytics tool or shop can tell which campaign sent the visitor. In AcelleMail, switch on Enable
UTM tracking under UTM tracking in the campaign's Setup step; every link then carries the
campaign's UTM parameters. Details: UTM Parameters in
AcelleMail and Email Campaign
ROI.
A worked example#
The counts from section 1, with the bounces and complaints added. Illustrative numbers, not a benchmark:
| Result |
Count |
| Sent |
10,000 |
| Bounced |
200 (150 hard, 50 soft) |
| Delivered |
9,800 |
| Unique opens |
3,920 |
| Unique clicks |
490 |
| Unsubscribes |
29 |
| Complaints |
5 |
| Orders |
49 |
| Metric |
Calculation |
Result |
| Delivery rate |
9,800 ÷ 10,000 |
98% |
| Bounce rate |
200 ÷ 10,000 |
2% (hard: 1.5%) |
| Open rate |
3,920 ÷ 9,800 |
40% |
| Click rate |
490 ÷ 9,800 |
5% |
| Click-to-open rate |
490 ÷ 3,920 |
12.5% |
| Unsubscribe rate |
29 ÷ 9,800 |
0.30% |
| Complaint rate |
5 ÷ 9,800 |
0.05% |
| Conversion rate (of delivered) |
49 ÷ 9,800 |
0.5% |
| Conversion rate (of clicks) |
49 ÷ 490 |
10% |
The complaint rate looks safe at 0.05%. Remember that it counts only the complaints that came back to
you.
7. Reading a campaign report in AcelleMail#
Open Campaigns → Email and click a sent campaign. Its report starts with four cards:

- Recipients: every contact on the lists or segments the campaign was sent to. That includes the
contacts it skipped because they were not Subscribed, or because email verification found them
Undeliverable, Risky or Unknown. It is not the number sent. In this example, 1,938 contacts were on
the list and 1,207 of them were Subscribed.
- Delivered: the messages your sending server accepted, 1,187 here, including any that bounce
later. Its percentage is of Recipients, so it is not a delivery rate. Messages that could not be
sent at all show as Failed under Statistics breakdown, 20 in this case. The delivery rate of
what was actually sent is 1,187 ÷ (1,187 + 20) = 98.3%.
- Opened: unique opens, as a percentage of Delivered.
- Clicked: unique clicks, as a percentage of Delivered. The click-to-open rate is not shown as a
figure of its own; here it is 47 ÷ 469 = 10%.
Further down, the Click rate card lists Total clicks next to Unique clicks. The rate uses
the unique count.
The figures are saved, not live. At the top of the report, next to "Last updated", the ↻ button
(Refresh campaign data) recalculates them in the background; come back a few minutes later. In the
campaign list, a campaign whose figures need updating says "No statistics or out-dated, click to
update".
Who did what. The Sending logs menu on the report (Logs on an A/B test) lists each contact
behind the numbers: the Delivery log, Bounce log, Feedback log, Open log, Click log
and Unsubscribe log.
Comparing campaigns. The campaign list shows Delivered, Open rate and Click rate for every campaign.
Type part of a name into the search box to line up similar sends:
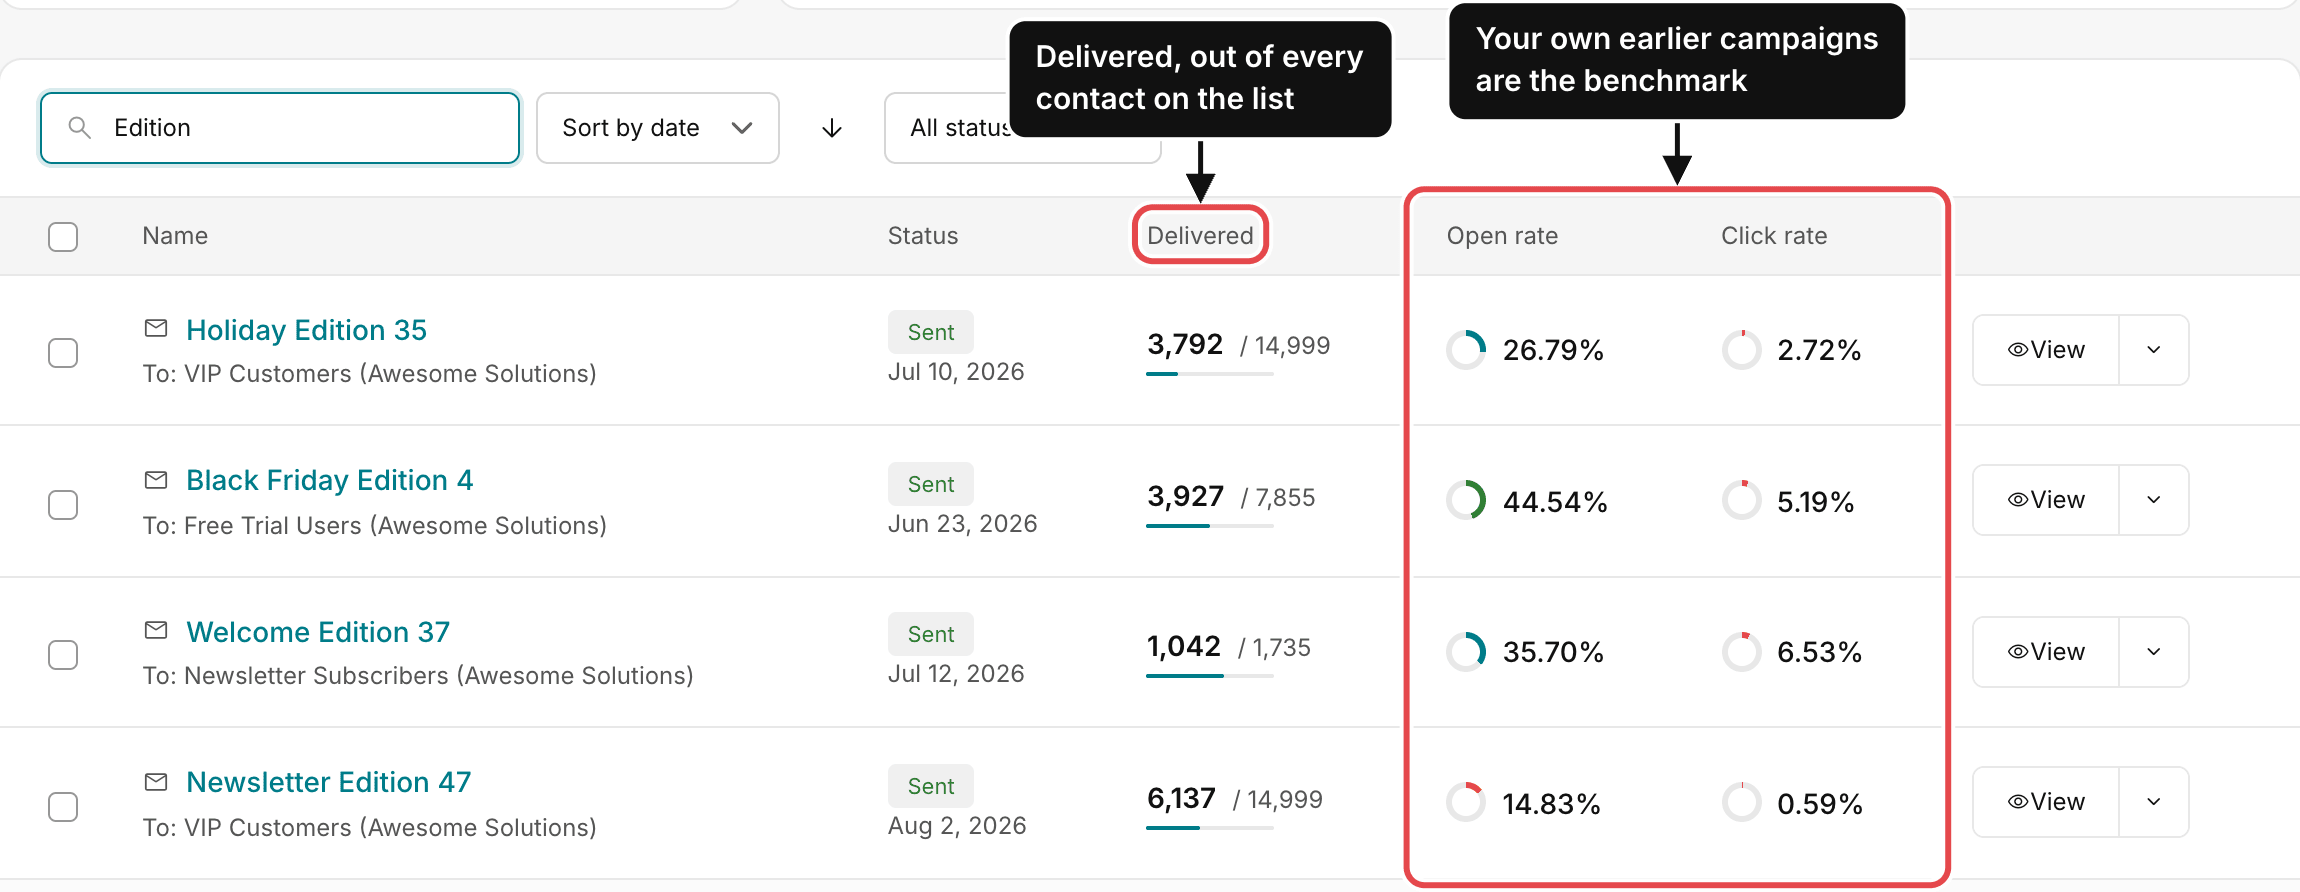
The number after the slash in the Delivered column is the same Recipients count as on the report:
every contact on the list.
8. Which numbers to judge a campaign by#
- Success: clicks and conversions. What readers did.
- Health: complaints, hard bounces and unsubscribes. Whether your list and your reputation are in
good shape. These are the numbers with limits attached (section 5).
- Opens: trends only. Compare within your own sends, never as an absolute.
This guide gives no "industry average" on purpose. Published averages mix audiences, countries and
counting methods, and many cannot say how much of their open rate is automatic. Your own history is the
benchmark that matters: the same kind of campaign, to the same list, over time. When you want to know
whether a change helped, change one thing at a time; see A/B Testing Email Subject
Lines.
9. Common mistakes#
| What you see |
Why it is a problem |
What to do |
| Your open rate compared with an "industry average" or another tool's |
Counting methods and denominators differ |
Compare with your own earlier campaigns |
| Recipients read as "how many we sent" |
It includes every contact the campaign skipped |
Use Delivered plus Failed for what was sent |
| A rising open rate celebrated |
Automatic opens can rise on their own, with no new readers |
Check that clicks rose too |
| Total clicks used as the click count |
Repeat clicks and link scanners inflate it |
Use unique clicks |
| "Zero complaints" taken at face value |
Gmail does not report complaints back |
Check Gmail Postmaster Tools |
| A report full of zeros right after sending |
The figures are saved and not yet updated |
Click ↻ next to "Last updated" |
| A conversion rate with no denominator |
Of delivered and of clicks differ tenfold |
Say which one you used |
Summary#
- Every rate is one count divided by another. Know which, and use unique counts.
- Delivered means accepted by the receiving server, not placed in the inbox.
- Opens are skewed both ways: Apple Mail Privacy Protection adds opens, blocked images hide them. Use
them for trends only.
- Judge success by clicks and conversions, and watch for link scanners.
- Keep complaints below 0.1% and hard bounces near zero. Your report sees only the complaints that come
back to you.
- Tag links with UTM parameters to measure what happens after the click.
- In AcelleMail, Recipients counts every contact on the list; read rates against Delivered, and refresh
saved figures with ↻.
- Benchmark against your own campaigns, not against averages.
Terms used here are defined in the Email Marketing Glossary.
